.webp?width=100&height=43&name=gohappy-logo-full-green-2%20(1).webp)
If you run goHappy new hire surveys, each survey (30-day, 60-day, 90-day, or your own cadence) has its own dashboard. New Hire Insights pulls all of those surveys together into a single view, so you can see how new hires feel across their whole onboarding journey instead of one survey at a time.
📋 Who this is for: New Hire Insights is available to customers using goHappy's templated new hire survey questions.
What's on the Dashboard
- Filters for date range and payroll data fields
- Strengths and opportunities, surfaced by AI
- Your overall onboarding score compared to the goHappy benchmark
- Ask My Data — an AI chat that knows your survey data
- Trends over time and a cohort table
- Drill-down by district or location
- Leaderboards, a participation map, and critical focus areas
- One-click export to PowerPoint or PDF
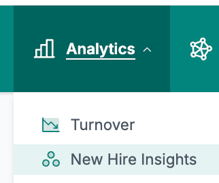
Where to Find It
Filters
Everything on the dashboard is filterable.
- Date range — defaults to the last 6 months. You can pick any single month or set a custom range.
- Payroll data fields — filter by location, job title, department, or any other field in your payroll data.
The whole dashboard updates based on the filters you choose.
Strengths and Opportunities
goHappy's AI reads the scores and comments across every new hire survey and surfaces:
- Your greatest strength — what's working best in your onboarding
- Your biggest change — the most notable shift in results
- Your top opportunities — where improvement will have the most impact
You'll also see your overall onboarding score compared against the goHappy benchmark, so you know how your onboarding stacks up.
Ask My Data
When you have a question that the dashboard doesn't answer directly, just ask it.
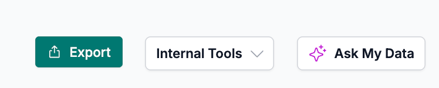
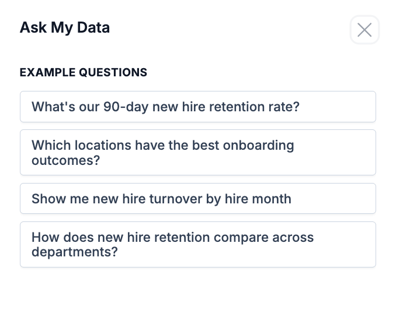
Ask My Data works like any AI chat, but it knows your survey data. Type a question in plain language — for example, "What are the top opportunities across our new hire surveys?" or "Which locations have the best onboarding outcomes?" It analyzes your data and gives you the answer right there.
Trends Over Time and the Cohort Table
Trends over time show how your onboarding scores are moving.
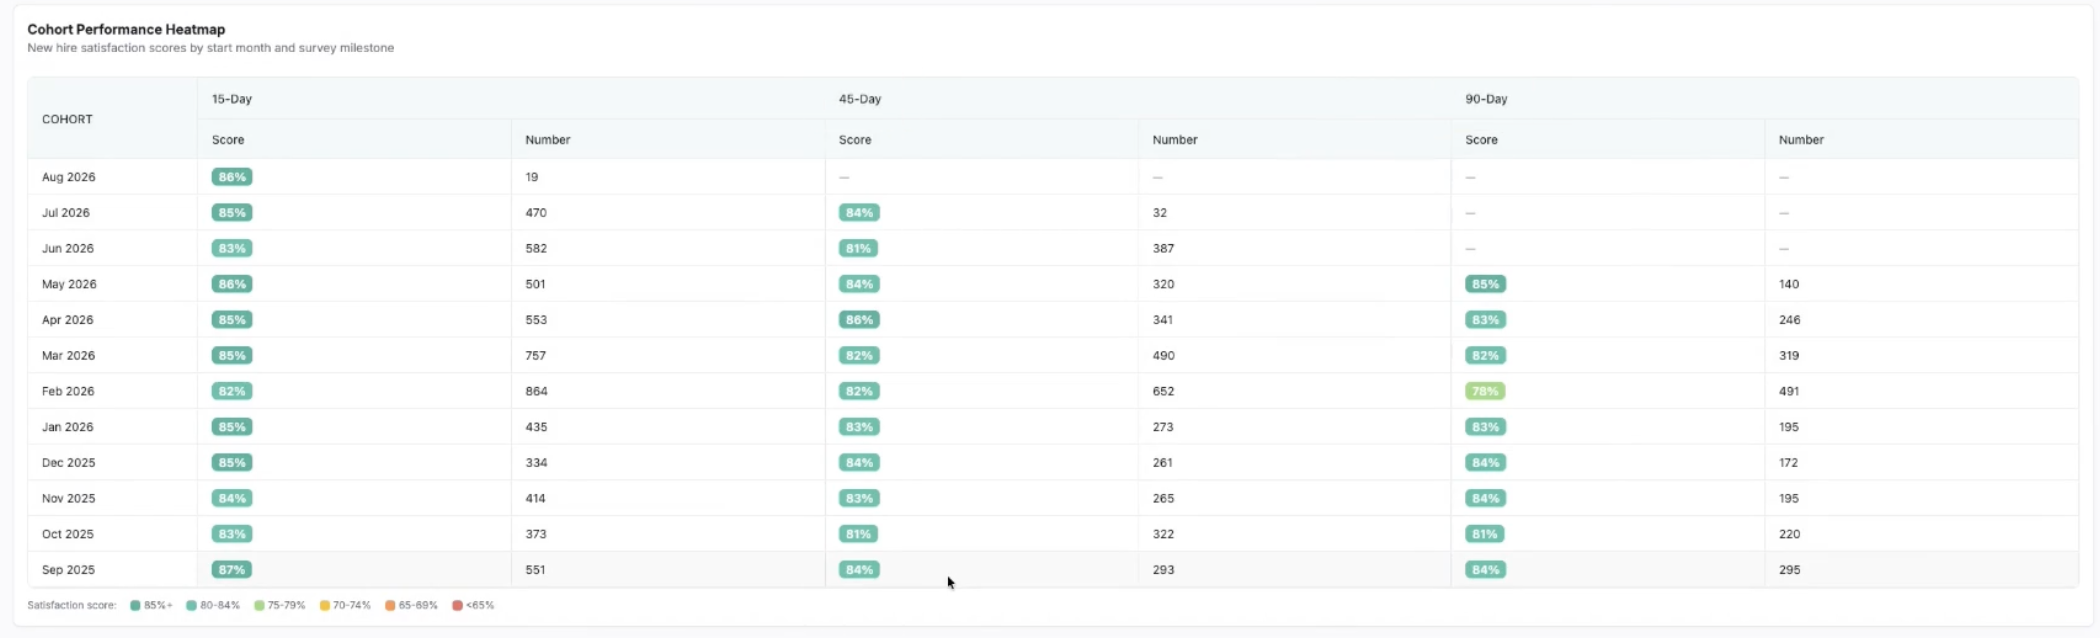
The cohort table groups everyone hired in a given month and tracks that group across each survey milestone. This is especially useful when you change your onboarding process.
💡 Example: If you launch a new onboarding program in March, you can watch the March cohort move through their 30, 60, and 90-day surveys and compare them to earlier cohorts to see the impact.
Drilling Into a District or Location
Everything on the dashboard is drillable. Click into a district or a single location and the entire dashboard reloads in that context — strengths, scores, trends, and everything else now reflect just that group.
Leaderboards, Participation Map, and Critical Focus Areas
Further down the dashboard you'll find:
- Leaderboards — your top performers and the areas that need attention
- Participation map — shows favorability across your organization
- Critical focus areas — calls out the specific questions where scores decline as new hires move through onboarding
Critical focus areas are a great starting point for action. A question that scores well at 30 days but drops by the 90 day survey points to a specific part of the onboarding experience worth looking into.

Exporting a Report
When you're ready to share results, click Export.
- Pick your audience
- Choose your breakdowns
- Select PowerPoint or PDF
goHappy builds the report for you, including talk tracks — so there's no need to take screenshots or copy and paste into a slide deck.
Frequently Asked Questions
How is this different from my individual survey dashboards? Each new hire survey still has its own dashboard. New Hire Insights combines all of them into one view so you can see the full onboarding journey and compare results across milestones.
Does this work with surveys I built myself? New Hire Insights is for customers using goHappy's templated new hire surveys and questions. A custom new hire survey with questions provided by the client does not work with New Hire Insights.
What does Ask My Data use to answer my questions? It analyzes your new hire survey data, scores, and comments to return the answer in the chat.
Can I share results with leaders who don't log into goHappy? Yes. Use Export to create a PowerPoint or PDF report, complete with talk tracks, for any audience you choose.